![]()
Sugar
Sugar and Education
Data Cleaning
CDC 2013 Source
TABLE 3. Crude prevalence* of sugar-sweetened beverage† consumption ≥1 time/day among adults, by employment status, education, and state — Behavioral Risk Factor Surveillance System, 23 states and District of Columbia, 2013
https://www.cdc.gov/mmwr/volumes/65/wr/mm6507a1.htm
import pandas as pd
cdc_2013 = pd.read_csv("https://raw.githubusercontent.com/noahgift/sugar/master/data/education_sugar_cdc_2003.csv")
cdc_2013.set_index("State", inplace=True)
cdc_2013.head()
| Employed | Not employed | Retired | <High school | High school | Some college | College graduate | |
|---|---|---|---|---|---|---|---|
| State | |||||||
| Alaska | 26.2 (23.6–28.9) | 32.1 (27.8–36.8) | 16.0 (12.6–20.2) | 47.1 (37.8–56.5) | 34.9 (31.1–38.9) | 24.2 (21.0–27.8) | 12.9 (10.5–15.7) |
| Arizona | 33.0 (28.5–37.8) | 28.7 (23.5–34.5) | 13.8 (10.8–17.5) | 40.4 (30.9–50.7) | 36.5 (30.7–42.7) | 24.4 (19.9–29.4) | 14.6 (11.6–18.3) |
| California | 22.9 (20.9–25.1) | 30.2 (27.1–33.4) | 15.0 (12.2–18.2) | 38.5 (34.2–43.0) | 29.9 (26.5–33.7) | 21.4 (18.8–24.2) | 11.5 (9.8–13.5) |
| Connecticut | 18.9 (17.1–20.9) | 24.3 (20.8–28.2) | 15.0 (12.7–17.7) | 27.8 (22.4–33.9) | 26.9 (23.7–30.3) | 19.9 (17.2–23.0) | 10.2 (8.7–12.0) |
| District of Columbia | 18.5 (15.7–21.7) | 34.6 (29.5–40.1) | 18.5 (15.3–22.1) | 45.6 (36.4–55.2) | 39.0 (33.1–45.2) | 28.9 (23.4–35.0) | 8.4 (7.0–10.1) |
for column in cdc_2013.columns:
  cdc_2013[column]=cdc_2013[column].str.replace(r"\(.*\)","")
  cdc_2013[column]=pd.to_numeric(cdc_2013[column])

cdc_2013.reset_index(inplace=True)
cdc_2013.head()
| State | Employed | Not employed | Retired | <High school | High school | Some college | College graduate | |
|---|---|---|---|---|---|---|---|---|
| 0 | Alaska | 26.2 | 32.1 | 16.0 | 47.1 | 34.9 | 24.2 | 12.9 |
| 1 | Arizona | 33.0 | 28.7 | 13.8 | 40.4 | 36.5 | 24.4 | 14.6 |
| 2 | California | 22.9 | 30.2 | 15.0 | 38.5 | 29.9 | 21.4 | 11.5 |
| 3 | Connecticut | 18.9 | 24.3 | 15.0 | 27.8 | 26.9 | 19.9 | 10.2 |
| 4 | District of Columbia | 18.5 | 34.6 | 18.5 | 45.6 | 39.0 | 28.9 | 8.4 |
cdc_2013.describe()
| Employed | Not employed | Retired | <High school | High school | Some college | College graduate | |
|---|---|---|---|---|---|---|---|
| count | 24.000000 | 24.000000 | 24.000000 | 24.000000 | 24.000000 | 24.000000 | 24.000000 |
| mean | 32.325000 | 35.408333 | 18.533333 | 44.662500 | 37.416667 | 30.262500 | 17.358333 |
| std | 9.917803 | 9.056485 | 5.975142 | 8.588658 | 8.243399 | 8.490138 | 6.730264 |
| min | 16.700000 | 21.500000 | 8.900000 | 27.800000 | 21.500000 | 16.900000 | 7.800000 |
| 25% | 23.400000 | 29.750000 | 14.625000 | 39.625000 | 31.925000 | 24.200000 | 12.850000 |
| 50% | 31.550000 | 32.600000 | 16.750000 | 46.350000 | 36.750000 | 28.200000 | 15.300000 |
| 75% | 42.025000 | 46.025000 | 22.550000 | 51.200000 | 46.525000 | 39.250000 | 23.500000 |
| max | 49.700000 | 49.500000 | 29.700000 | 60.000000 | 50.800000 | 47.200000 | 34.900000 |
Education and Sugar
!wget https://raw.githubusercontent.com/python-visualization/folium/master/examples/data/us-states.json
!ls -l
--2019-03-20 23:57:49--  https://raw.githubusercontent.com/python-visualization/folium/master/examples/data/us-states.json
Resolving raw.githubusercontent.com (raw.githubusercontent.com)... 151.101.0.133, 151.101.64.133, 151.101.128.133, ...
Connecting to raw.githubusercontent.com (raw.githubusercontent.com)|151.101.0.133|:443... connected.
HTTP request sent, awaiting response... 200 OK
Length: 87688 (86K) [text/plain]
Saving to: ‘us-states.json.2’

us-states.json.2    100%[===================>]  85.63K  --.-KB/s    in 0.02s

2019-03-20 23:57:50 (3.39 MB/s) - ‘us-states.json.2’ saved [87688/87688]

total 280
drwxr-xr-x 1 root root  4096 Mar  8 17:26 sample_data
-rw-r--r-- 1 root root 87688 Mar 20 22:43 us-states.json
-rw-r--r-- 1 root root 87688 Mar 20 22:43 us-states.json.1
-rw-r--r-- 1 root root 87688 Mar 20 23:57 us-states.json.2
Low Education == High Sugar
import folium
m = folium.Map(location=[36, -102], zoom_start=3)

folium.Choropleth(
    geo_data="us-states.json",
    name='choropleth',
    data=cdc_2013,
    columns=['State', '<High school'],
    key_on='feature.properties.name',
    fill_color='OrRd',
    fill_opacity=0.7,
    line_opacity=0.2,
    legend_name='<High school Education and Grams Sugar Intake Daily'
).add_to(m)

folium.LayerControl().add_to(m)

m
College Education Major Decrease in Sugar Intake
import folium
m = folium.Map(location=[36, -102], zoom_start=3)

folium.Choropleth(
    geo_data="us-states.json",
    name='choropleth',
    data=cdc_2003,
    columns=['State', 'College graduate'],
    key_on='feature.properties.name',
    fill_color='OrRd',
    fill_opacity=0.7,
    line_opacity=0.2,
    legend_name='College graduate and Grams Sugar Intake Daily'
).add_to(m)

folium.LayerControl().add_to(m)

m
Median Daily Sugar Intake by Category
cdc_2003.columns
Index(['State', 'Employed', 'Not employed', 'Retired', '<High school',
       'High school', 'Some college', 'College graduate'],
      dtype='object')
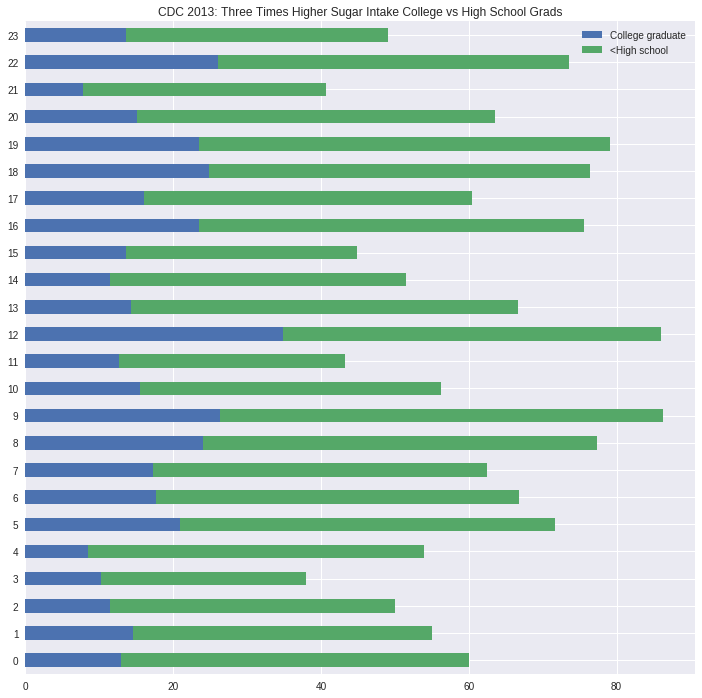
College Graduate
cdc_2003["College graduate"].median()
15.3
cdc_2003["<High school"].median()
46.35
cdc_2003[["State","College graduate", "<High school"]].plot.barh(
    stacked=True, figsize=(12, 12)).set_title("CDC 2013: Three Times Higher Sugar Intake College vs High School Grads")
Text(0.5, 1.0, 'CDC 2013: Three Times Higher Sugar Intake College vs High School Grads')