Cloud Databases
Cloud Databases
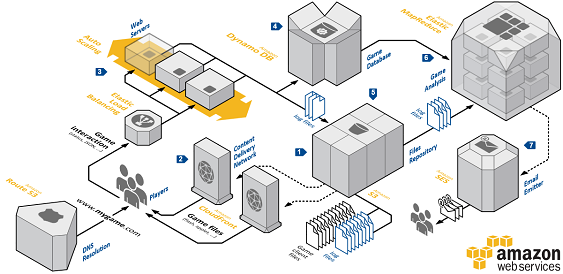
A big takaway in the cloud is you don’t have to start with a relational database. The CTO of Amazon, Werner Vogel’s brings up some of the options available in the blog post A one size fits all database doesn’t fit anyone.
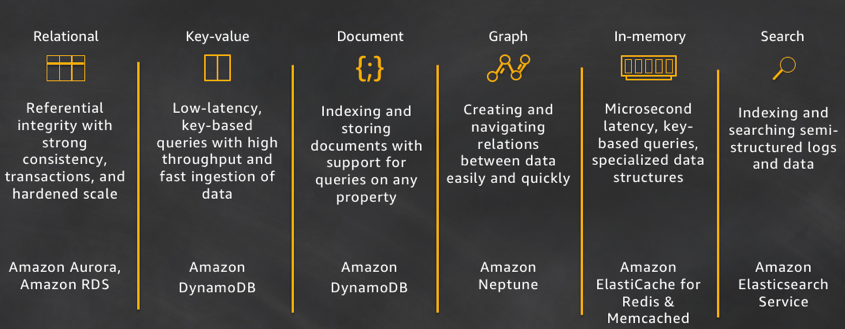 source: allthingsdistributed.com
Key Value Databases
A good example of a serverless key/value database is Dynamodb.
How could you query it in Python?
def query_police_department_record_by_guid(guid):
    """Gets one record in the PD table by guid

    In [5]: rec = query_police_department_record_by_guid(
        "7e607b82-9e18-49dc-a9d7-e9628a9147ad"
        )

    In [7]: rec
    Out[7]:
    {'PoliceDepartmentName': 'Hollister',
     'UpdateTime': 'Fri Mar  2 12:43:43 2018',
     'guid': '7e607b82-9e18-49dc-a9d7-e9628a9147ad'}
    """

    db = dynamodb_resource()
    extra_msg = {"region_name": REGION, "aws_service": "dynamodb",
        "police_department_table":POLICE_DEPARTMENTS_TABLE,
        "guid":guid}
    log.info(f"Get PD record by GUID", extra=extra_msg)
    pd_table = db.Table(POLICE_DEPARTMENTS_TABLE)
    response = pd_table.get_item(
        Key={
            'guid': guid
            }
    )
    return response['Item']
Graph Databases
Why Not Relational Databases?
- Relationship data not good for relational databases.
- Example:
- Think about SQL query of social network used to select all third-degree connections of individual.
- Imagine number of joins needed.
- Think about SQL query of social network used to select all third-degree connections of individual.
- Think about SQL query used to get full social network of individual.
- Imagine number of recursive joins required.
- Relational databases good at representing one-to-many relationships, in which one table connected to multiple tables.
AWS Neptune

Neo4j
Key Concepts
reference Neo4j website sandbox tutorial
Graph Database
Graph Database can store:
- Nodes - graph data records
- Relationships - connect nodes
- Properties - named data values
Simplest Graph
Simplest Graph
- One node
- Has some properties
- Start by drawing a circle for the node
- Add the name Emil
- Note that he is from Sweden
- Nodes are the name for data records in a graph
- Data is stored as Properties
- Properties are simple name/value pairs

Labels
Nodes can be grouped together by applying a Label to each member. In our social graph, we’ll label each node that represents a Person.
- Apply the label “Person” to the node we created for Emil
- Color “Person” nodes red
- A node can have zero or more labels
- Labels do not have any properties

More Nodes
Like any database, storing data in Neo4j can be as simple as adding more records. We’ll add a few more nodes:
- Emil has a klout score of 99
- Johan, from Sweden, who is learning to surf
- Ian, from England, who is an author
- Rik, from Belgium, has a cat named Orval
- Allison, from California, who surfs
- Similar nodes can have different properties
- Properties can be strings, numbers, or booleans
- Neo4j can store billions of nodes

Relationships
The real power of Neo4j is in connected data. To associate any two nodes, add a Relationship which describes how the records are related.
In our social graph, we simply say who KNOWS whom:
- Emil KNOWS Johan and Ian
- Johan KNOWS Ian and Rik
- Rik and Ian KNOWS Allison
- Relationships always have direction
- Relationships always have a type
- Relationships form patterns of data

Relationship Properties
In a property graph, relationships are data records that can also** contain properties**. Looking more closely at Emil’s relationships, note that:
- Emil has known Johan since 2001
- Emil rates Ian 5 (out of 5)
- Everyone else can have similar relationship properties

Key Graph Algorithms (With neo4j)
-
Centrality - What are the most important nodes in the network? PageRank, Betweenness Centrality, Closeness Centrality
-
Community detection - How can the graph be partitioned? Union Find, Louvain, Label Propagation, Connected Components
-
Pathfinding - What are the shortest paths or best routes available given cost? Minimum Weight Spanning Tree, All Pairs- and Single Source- Shortest Path, Dijkstra
CALL dbms.procedures()
YIELD name, signature, description
WITH * WHERE name STARTS WITH "algo"
RETURN *
Russian Troll Walkthrough [Demo]
To run through example run this cipher code in their sandbox
:play https://guides.neo4j.com/sandbox/twitter-trolls/index.html
Finding top Trolls with Neo4J
The list of prominent people who tweeted out links from the account, @Ten_GOP, which Twitter shut down in August, includes political figures such as Michael Flynn and Roger Stone, celebrities such as Nicki Minaj and James Woods, and media personalities such as Anne Coulter and Chris Hayes
A screenshot of the Neo4J interface for the phrase “thanks obama”.

Pagerank score for Trolls
Here is a walkthrough of code in a colab notebook you can reference called social network theory.
def enable_plotly_in_cell():
  import IPython
  from plotly.offline import init_notebook_mode
  display(IPython.core.display.HTML('''
        <script src="/static/components/requirejs/require.js"></script>
  '''))
  init_notebook_mode(connected=False)
The trolls are exported from Neo4j and they are imported in Pandas.
import pandas as pd
import numpy as np

df = pd.read_csv("https://raw.githubusercontent.com/noahgift/essential_machine_learning/master/pagerank_top_trolls.csv")
df.head()

Next up, the data is graphed with Plotly.
import plotly.offline as py
import plotly.graph_objs as go

from plotly.offline import init_notebook_mode
enable_plotly_in_cell()
init_notebook_mode(connected=False)


fig = go.Figure(data=[go.Scatter(
    x=df.pagerank,
    text=df.troll,
    mode='markers',
    marker=dict(
        color=np.log(df.pagerank),
        size=df.pagerank*5),
)])
py.iplot(fig, filename='3d-scatter-colorscale')

Top Troll Hashtags
import pandas as pd
import numpy as np

df2 = pd.read_csv("https://raw.githubusercontent.com/noahgift/essential_machine_learning/master/troll-hashtag.csv")
df2.columns = ["hashtag", "num"]
df2.head()

Now plot these troll hashtags.
import plotly.offline as py
import plotly.graph_objs as go

from plotly.offline import init_notebook_mode
enable_plotly_in_cell()
init_notebook_mode(connected=False)


fig = go.Figure(data=[go.Scatter(
    x=df.pagerank,
    text=df2.hashtag,
    mode='markers',
    marker=dict(
        color=np.log(df2.num),
        size=df2.num),
)])
py.iplot(fig)
You can see these trolls love to use the hashtag #maga.
